The polls and the pundits got it wrong.
Again.
First there was the Brexit referendum in the United Kingdom last June, which every political analyst and pollster said wouldn’t pass.
It did.
Then, of course, there was the U.S. presidential election of Donald J. Trump last Tuesday.
Despite all the official predictions — which it seemed even Trump’s people believed — the Republican won by a landslide in Electoral Colleges votes to become the United States’ 45th president-elect.
And lest we forget, there were the predictions that the New York Stock Exchange would plummet if Trump were to win the election.
Well, guess what?
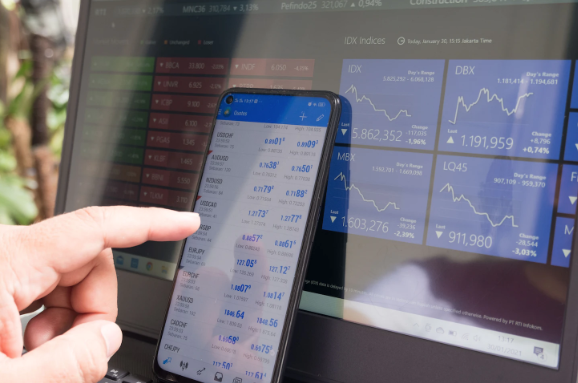
After an initial nosedive immediately leading up to and following the elections, the Dow Jones industrial average hit an all-time record high of 18,873.66 points on Thursday (just two days after the elections), and the S&P 500 extended its gains, putting it on track for its best weekly performance since October 2014.
So how do the pollsters and data-based prognosticators manage to get it so wrong so often?
To begin with, as I have pointed out previously (see “Damned Lies and Statistics,” which ran in this space on Nov. 4), statistical surveys can easily be manipulated by selective case studies, small group inclusions and a biased focus on data review.
Also, not everyone wants to participate in surveys, and their declination to be polled can skew the results of the inquiry.
In the case of the Trump victory, for example, many GOP voters later admitted that they were reluctant to tell other people that they supported the billionaire reality show star because they felt they would be ridiculed by diehard Democrats who had openly expressed disdain toward and a sense of intellectual superiority over Trump supporters.
Moreover, most statisticians base their findings on true/false or even multiple choice questions which do not take into account the gray areas of complex answers.
Asking someone “Do you support or oppose Brexit?” does not allow them to reply that they may not like the possibility of certain economic and political consequences from of an exit from the European Union, but feel that overall their country would be better off if it goes it alone.
Because most predictive models are based on easily accessible audiences, there is an inherent tendency to include more urban subjects than rural ones, since, in general, polling organizations are located inside large cities.
This also leads to an intrinsic selectivity and bias.
And, finally, elderly people tend to be more leery of answering questions from strangers than their millennium counterparts, who are eager to share their every move and meal with thousands of friends on Facebook or Twitter.
Many polls today are conducted using robo-calling technology or internet popup surveys, which likewise excludes exposure to some older voters, who might be less tech-savvy or spend less time on their computers.
This reality can stilt poll results to encompass a younger vision, which is usually more liberal.
In the end, polls provide a sampling, a guestimate, and not an absolute certainty of what will happen.
Polls are not the Word of God; they are a simple way of taking the pulse of a particular audience, and their reliability is dependent on how wide a net they cast, how they are conducted and who is conducting them.
It is certainly easy to be a Monday morning quarterback when analyzing a vote result in hindsight.
But never forget that pollsters and pundits are human beings, and are, by definition, subject to human prejudices and biases.
In the case of all endeavors, polls can be flawed by those predispositions, so, as I said before, when considering the validity of any data-based prognostication, start by considering the source and caveat emptor.
Thérèse Margolis can be reached at [email protected].


